

JMX is a Java technology that supplies tools for managing and monitoring applications, system objects, devices and service-oriented networks. Those resources are represented by objects called MBeans (for Managed Bean).
Kamon jmx module is currently available for Scala 2.10, 2.11 and 2.12.
Supported releases and dependencies are shown below.
| kamon-jmx | status | jdk | scala | akka |
|---|---|---|---|---|
| 0.6.5 | stable | 1.7+, 1.8+ | 2.10, 2.11, 2.12 | 2.3.x, 2.4.x |
To get started with SBT, simply add the following to your build.sbt
file:
libraryDependencies += "io.kamon" %% "kamon-jmx" % "0.6.7"The JMX module subscribes itself to the entities included in the kamon.jmx.subscriptions key. By default, the following subscriptions are included:
kamon.jmx {
  subscriptions {
    histogram       = [ "**" ]
    min-max-counter = [ "**" ]
    gauge           = [ "**" ]
    counter         = [ "**" ]
    trace           = [ "**" ]
    trace-segment   = [ "**" ]
    akka-actor      = [ "**" ]
    akka-dispatcher = [ "**" ]
    akka-router     = [ "**" ]
    system-metric   = [ "**" ]
    http-server     = [ "**" ]
  }
}
If you are interested in reporting additional entities to JMX please ensure that you include the categories and name patterns accordingly.
For all single instrument entities (those tracking counters, histograms, gaugues and min-max-counters) the generated metric key will follow the kamon.instrument-type.entity-name pattern. Additionaly all tags supplied when creating the instrument will also be reported.
- Connection: For connect to your application you need [add some JVM parameters] for start JMX agent and install a JMX client (for example VisualVM)
- Histogram percentile: You may calculate any percentile on hystogram values.

Here is a very simple example of a JMX values in VisualVM MBeans plugin with metrics reported by Kamon:
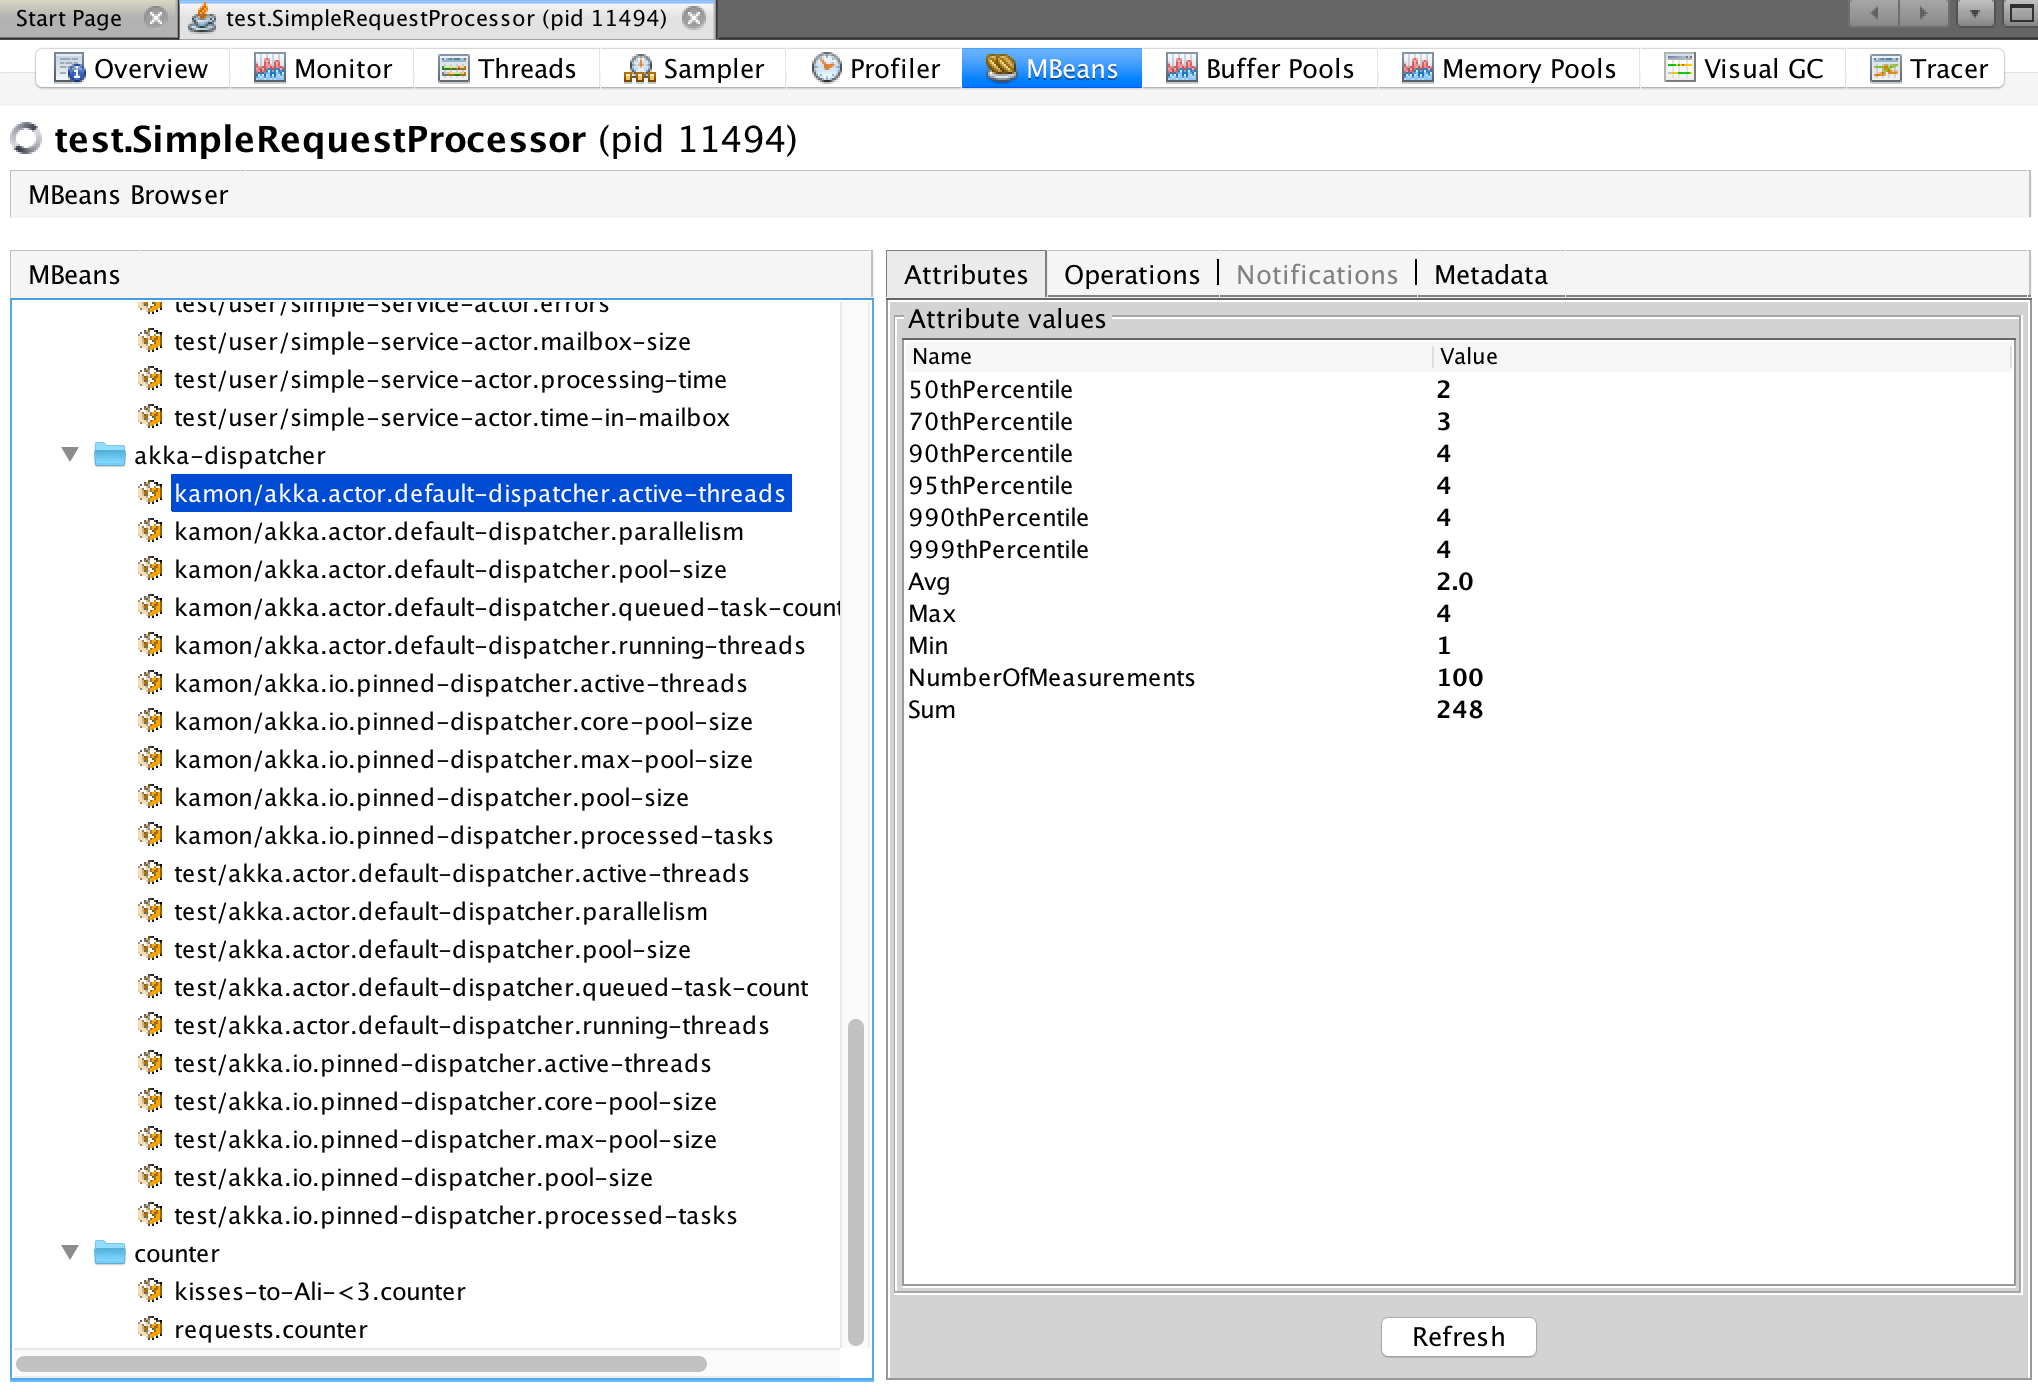
The kamon-jmx module now provides both moving metrics data into JMX and exporting metrics out of JMX. So just like above, add the kamon-jmx dependency to your project and ensure that it is in your classpath at runtime, that’s it. Kamon’s module loader will detect that the JMX module is in the classpath and automatically start it.
To use the JMX to Kamon functionality, you must do three things. First, you add a subscription named kamon-mxbeans to the kamon.jmx.subscriptions key. Here is an example:
kamon.jmx {
  subscriptions {
    histogram       = [ "**" ]
    min-max-counter = [ "**" ]
    gauge           = [ "**" ]
    counter         = [ "**" ]
    trace           = [ "**" ]
    trace-segment   = [ "**" ]
    system-metric   = [ "**" ]
    http-server     = [ "**" ]
    kamon-mxbeans   = [ "**" ]
  }
}
Note: only the kamon-mxbeans line is important here. You can add or remove other subscriptions here without effecting the behavior of the JMX metrics exporting.
Second, add the kamon-mxbeans module to the kamon.modules part of the configuration. Here is an example:
kamon.modules {
  kamon-mxbeans {
    auto-start = yes
    requires-aspectj = no
    extension-class = "kamon.jmx.extension.JMXMetricImporter"
  }
}
Finally, add a kamon.kamon-mxbeans configuration object to your config. Here is an example:
kamon.kamon-mxbeans {
  mbeans = [
    { "name": "example-mbean", "jmxQuery": "example:type=myBean,name=*",
      "attributes": [
        { "name": "Counter1", "type": "counter" },
        { "name": "Counter2", "type": "counter" }
      ]
    }
  ],
  identify-delay-interval-ms = 1000,
  identify-interval-ms = 1000,
  value-check-interval-ms = 1000
}
The jmxQuery allows this Kamon module to find the mbean(s) that should be exported to Kamon. The name is the Kamon name of this new metric. The attributes are metrics to export to Kamon and the type of metric to export. The supported types are counter, guage, min_max_counter and histogram. The identify-delay-interval-ms is the number of milliseconds to wait before querying JMX the first time. The identify-interval-ms is how often to query JMX for new mxbeans. And value-check-interval-ms is the number of milliseconds between polling of known mxbeans for new metric values.
kamon {
  jmx {
    subscriptions {
      histogram       = [ "**" ]
      min-max-counter = [ "**" ]
      gauge           = [ "**" ]
      counter         = [ "**" ]
      trace           = [ "**" ]
      trace-segment   = [ "**" ]
      akka-actor      = [ "**" ]
      akka-dispatcher = [ "**" ]
      akka-router     = [ "**" ]
      system-metric   = [ "**" ]
      http-server     = [ "**" ]
      # Here is the addition of the JMX exporting functionality to the subscriptions
      kamon-mxbeans   = [ "**" ]
    }
  }

  # adding the JMX to Kamon module
  modules {
    kamon-mxbeans {
      auto-start = yes
      requires-aspectj = no
      extension-class = "kamon.jmx.extension.JMXMetricImporter"
    }
  }

  # Configuring what JMX metrics to export to Kamon
  kamon-mxbeans {
    mbeans = [
      { "name": "my-mbean", "jmxQuery": "test:type=exampleBean,name=*",
        "attributes": [
      { "name": "Value1", "type": "counter" },
      { "name": "Value2", "type": "counter" } ] }
    ],
    identify-delay-interval-ms = 1000,
    identify-interval-ms = 1000,
    value-check-interval-ms = 1000
  }
}